
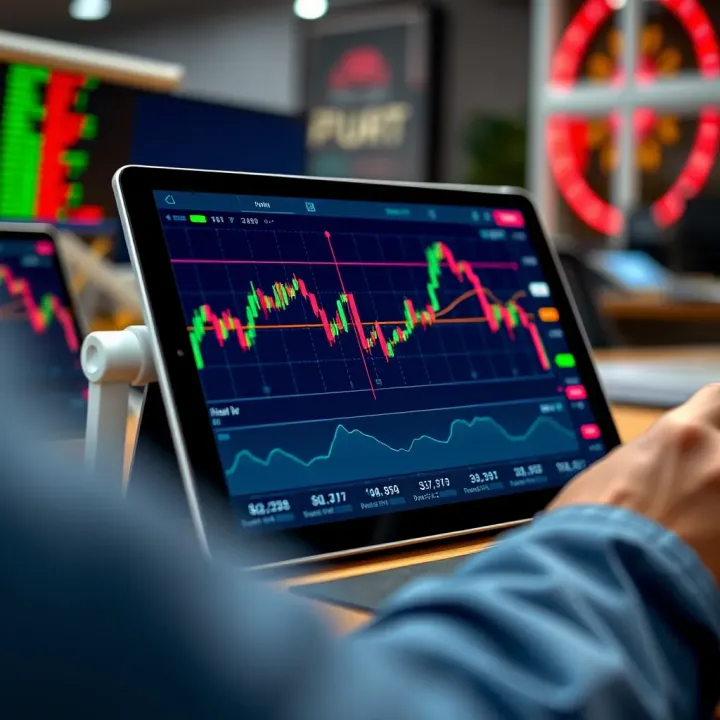
Best Tablets for Trading in India
📱 Find the best tablets for trading in India with fast performance, sharp displays & reliable connectivity. Choose models that fit your trading style perfectly.
Edited By
William Harper
In Bitcoin trading, understanding the daily candle close time is key to making informed decisions. Unlike traditional stocks, Bitcoin markets operate 24x7, so the daily candle does not close as per a fixed local timezone but follows a global standard, usually set at Coordinated Universal Time (UTC). For traders and investors in India, this creates a gap between the actual candle close and Indian Standard Time (IST), which is UTC plus 5 hours and 30 minutes.
A daily candle on a Bitcoin chart represents price movement within a 24-hour window. It comprises four points: open, high, low, and close. The closing price marks the most vital moment of that day’s trading range because it often indicates market sentiment and can influence trading strategies. However, since the candle closes according to a unified global time (normally 5:30 am IST), Indian traders must be aware that the "daily" close on their charts does not align with midnight in India.

For example, when it's midnight in Mumbai, the Bitcoin daily candle close is still running and will only close after 5:30 am, meaning the 'day' on the chart starts and ends mid-morning Indian time.
This timing difference has practical implications. Indian traders monitoring daily candles might misinterpret price signals if they assume the candle closes at midnight IST. This misunderstanding can lead to mistimed trades or inaccurate analysis, especially when comparing Bitcoin’s daily performance to Indian stock market sessions or local news events.
To navigate this, traders should:
Check their charting platform’s timezone setting—most platforms like TradingView or Binance align candle closes to UTC.
Adjust their analysis timing to consider the 5.5-hour difference from IST.
Use candle close times to gauge entry and exit points accurately, knowing that the 'day' in Bitcoin trading spans across two Indian calendar days.
In summary, recognising that Bitcoin daily candle close happens around 5:30 am IST helps Indian market participants plan their trades better. It ensures they react to genuine daily closes rather than partial data, leading to more precise investment decisions.
Bitcoin daily candle charts are invaluable tools for traders and investors in India aiming to understand price movements over time. These charts condense a day's trading activity into a single visual representation, making it easier to spot trends and potential reversals. For example, a trader in Mumbai tracking Bitcoin prices can quickly assess the market sentiment by observing daily candle patterns rather than sifting through minute-by-minute data.
Candlestick charts display price data in a way that's easy to interpret. Each candle shows how the price moved during a specific period—in this case, a day. Unlike simple line charts, candlesticks give details about price fluctuations within that timeframe, revealing underlying buying or selling pressure.
Every daily candle comprises four key data points: the opening price when the day started, the highest price attained, the lowest price reached, and the closing price at the end of the day. For instance, if Bitcoin opened at ₹22,00,000 in the morning, touched a high of ₹22,50,000, dropped to a low of ₹21,80,000 during the day, and closed at ₹22,20,000 by the evening, the candle visually represents all this in its shape and colour.
For Bitcoin, which can be highly volatile, candlestick charts provide more nuanced insight than line graphs. Traders can spot patterns like hammers or doji candles that often hint at reversals or continuations, helping them time their trades better. Also, candlestick charts combine price movements and investor sentiment, which is crucial for understanding Bitcoin's unpredictable market.
A daily candle aggregates all Bitcoin price activity within a 24-hour cycle. This means from one daily close to the next, all fluctuations, highs, lows, openings, and closings form that single candle. For Indian traders, grasping when this 24-hour window closes is essential to interpreting charts correctly.
Daily candles offer a good balance between detail and bigger-picture trends. They filter out the noise common in shorter timeframes, like minute or hourly charts, giving clearer indications of overall market direction. So, if an Indian investor notices several consecutive bullish daily candles, it could signify a strong upward trend worth following.

Besides daily charts, traders often refer to shorter timeframes such as 15-minute or hourly charts to fine-tune entry and exit points. On the other hand, weekly or monthly candles help analyse long-term trends. Combining these timeframes helps Indian traders get both micro and macro views of Bitcoin's price movements.
Understanding daily candle charts lays the foundation for making informed Bitcoin trading decisions, especially when considering India’s time zone differences and market patterns.
Understanding the Bitcoin daily candle close time is vital for traders and investors in India. The daily candle close marks the end of one full trading day on the chart and sets the stage for analysing price movements. Since Bitcoin trades across global exchanges operating in different time zones, knowing exactly when this daily close occurs in Indian Standard Time (IST) helps you make precise decisions when buying or selling.
Most cryptocurrency exchanges align their daily candle close to Coordinated Universal Time (UTC), which does not change with seasons. This uniformity makes UTC a global baseline, ensuring that traders from different countries refer to the same cut-off moment. For example, a daily candle closing at 00:00 UTC means every trader worldwide sees one complete day's data from that exact time.
Exchanges generate candle charts by collecting price, volume, and trade data over fixed intervals. Typically, the daily candle closes at midnight UTC, after which a new candle starts. However, some platforms like Binance or Coinbase may offer customised interval settings or operate using another time zone internally, but UTC remains widely preferred for daily charts. This standardisation supports consistent technical analysis across platforms.
UTC acts as the backbone for synchronising markets globally, including crypto. Since crypto markets run 24/7, marking a fixed daily close helps delineate trading sessions systematically. Regardless of where you are, referring to UTC reduces confusion over candle timings. For instance, traders in London, New York, or Mumbai, all coordinate their analysis based on the same UTC daily close.
Indian Standard Time is 5 hours and 30 minutes ahead of UTC. To convert the Bitcoin daily candle close into IST, simply add 5 hours and 30 minutes to the UTC close time. So, a daily candle closing at 00:00 UTC will close at 5:30 am IST the next day. This offset is crucial for Indian traders to align their trading activities with global timing.
For the standard daily candle that closes at midnight UTC, Indian traders see the close happen at 5:30 am IST. This means if you check your daily Bitcoin charts early morning, the candle from the previous day has just closed. Hence, conducting your analysis or placing trades after 5:30 am IST ensures you’re acting on the most updated daily information.
The time difference can affect the way Indian traders react to market movements. For example, if significant price changes occur post-5:30 am IST, it means the new candle has started and the previous day’s chart updated. Traders in India need to be aware that the ‘daily’ they see on charts is shifted by this offset. This awareness prevents misinterpretation of candle closes and avoids mistimed entries or exits.
Accurate knowledge of Bitcoin’s daily candle close time in IST helps Indian traders to synchronise with global markets and make informed decisions confidently.
By understanding these timings clearly, you can better plan your trading day, set alerts for daily closes, and interpret price trends without confusion caused by timezone gaps.
The daily candle close plays a vital role in shaping trading decisions for Indian Bitcoin traders. This specific point in time marks the completion of a 24-hour price period on the Bitcoin chart, providing a reliable snapshot of market sentiment. Since the candle’s close price reflects the final traded value within the day, it becomes a trusted reference to gauge momentum and overall trend direction.
Using daily close to identify trends: The daily close forms the backbone of technical trend analysis. Traders often look at consecutive daily closes to determine whether the market is bullish or bearish. For instance, consistent closes above a moving average suggest an upward trend, while closes below may hint at a downward movement. Indian traders can particularly benefit from this when planning trades after the day ends, aligning their decisions with confirmed market movements.
Strategies based on daily candle closes: Many trading strategies hinge on the daily candle close. One popular approach involves waiting for the daily candle to close beyond key support or resistance levels before entering a trade, reducing the chance of false breakouts. Another strategy uses the daily close to time stop-losses or to plan entries aligned with market patterns, such as reversal formations seen on the daily chart. In the Indian context, where volatility around global market timings can be sharp, relying on daily closes prevents premature decisions influenced by intraday noise.
Examples from the Indian trading context: Suppose a trader in Mumbai notices Bitcoin consistently closing above ₹25,00,000 on the daily chart over several days, indicating strong buying interest. They may decide to take a long position the next day, betting the trend will continue. Conversely, if the daily closing candle repeatedly falls below a major support level, say ₹22,00,000, the trader might avoid new buying or move to limit losses. This practical application showcases why recognising daily candle closes in IST is essential for well-timed entries and exits.
Misinterpreting time zones: One frequent error Indian traders make is confusing the candle close timing in UTC with their local Indian Standard Time (IST). Since UTC is 5 hours and 30 minutes behind IST, failing to convert correctly can lead to analysing incomplete candles or premature reactions. For example, a trader checking prices at 10:00 pm IST might see an active candle that hasn’t closed yet, leading to misreading the day's trend.
Relying on local exchange times vs UTC: Another mistake is depending on the local time zone of the exchange rather than UTC for candle closures. Some global exchanges operate on UTC, while a few may use their own local time settings. Indian traders need to be clear which timezone their charts follow to prevent errors—for instance, assuming candles close at 12:00 midnight IST when the exchange closes daily candles at 6:30 am IST (midnight UTC). This discrepancy affects trade timing and risk management.
How to check candle close times on popular Indian platforms: Most widely used trading platforms in India, such as WazirX, CoinDCX, or international portals accessed from India, usually show candle times in UTC by default. Traders should explore platform settings to adjust or confirm the displayed time zone. Setting alerts aligned with candle close times in IST helps ensure timely responses. Confirming the daily candle close time in the platform’s documentation or help centre also prevents confusion.
Accurate understanding of daily candle close times, especially converting from UTC to IST, equips Indian Bitcoin traders to avoid costly misreads and make informed, timely decisions.
In essence, the daily candle close is more than just a chart point—it forms the foundation of solid trading practices. Indian traders need to integrate this understanding into their analysis by recognising time zone differences and adopting strategies that respect the daily close’s significance.
Monitoring Bitcoin daily candles accurately helps Indian traders make better-informed decisions. The daily candle close reflects the market's sentiment at the end of a 24-hour cycle, crucial for identifying trends and planning trades effectively. Since crypto markets run 24/7 but international exchanges often use UTC for timing, Indian traders need practical tools to bridge the time difference and track daily closes with precision.
Several trading platforms popular in India offer real-time Bitcoin charts with adjustable timezones. Platforms like WazirX, CoinDCX, and international ones such as Binance and TradingView provide detailed candle charts. These platforms display price movements according to the exchange's server time, usually UTC, which may differ from IST. WazirX, for instance, is heavily used by Indian traders and integrates local payment methods, but still shows candle times in UTC by default.
Adjusting timezone on charts is essential to align candle closes with India's daily schedule. TradingView allows users to change chart timezones easily; setting it to IST (+5:30) will show candle closures at local time, reducing confusion about when a daily candle ends. Without this adjustment, traders might misread candle closes, leading to wrong entry or exit timing.
Setting alerts for daily candle close can save time and improve trade timing. Most platforms let you create notifications that trigger when a candle closes or the price hits certain levels near the close time. For instance, if you aim to act right after the daily close for your strategy, setting an alert 5–10 minutes before the IST equivalent of 5:30 am UTC helps you stay ready. This is especially useful during volatile days when market moves accelerate close to the daily cutoff.
Indian traders benefit from best practices like avoiding rash decisions right at the candle close. Markets tend to exhibit increased volatility near this point, causing price spikes or dips that may not sustain. Waiting for a few minutes post-close allows confirmation of trend direction before committing to trades.
Balancing short-term and long-term views is important. While intraday trading reacts to daily candles for momentum, longer-term investors look for consistent candle patterns over days or weeks. For Indian traders managing SIP investments or crypto portfolios, daily closes offer valuable checkpoints but shouldn't drive impulsive decisions.
Dealing with high volatility near close time requires caution. Indian traders often notice sharp price swings in the minutes leading to the daily close (5:30 am IST). These movements relate to global market activity and order book adjustments. Using stop-loss orders and not over-leveraging during these periods helps manage risk effectively.
Keeping track of Bitcoin's daily candle close using adjusted chart timezones and alerts lets Indian traders sync their actions with global market rhythms, avoiding costly timing errors.
Through practical use of charting tools, timezone settings, and strategic trading habits, you can harness daily candle data for smarter Bitcoin trading in India.
📱 Find the best tablets for trading in India with fast performance, sharp displays & reliable connectivity. Choose models that fit your trading style perfectly.

Explore Bitcoin price prediction for 2040 📈, analysing its history, market trends, expert views, and key factors shaping its value for Indian investors.

Explore DERV fuel use in India's industries 🚛, its chemical nature, pricing trends ₹, environmental impact, and the regulations shaping its future role in energy.

Explore the Tehsildar's vital role in India 🌍 from revenue duties ₹ to law enforcement and public service, plus challenges and reforms shaping this essential office.
Based on 10 reviews