
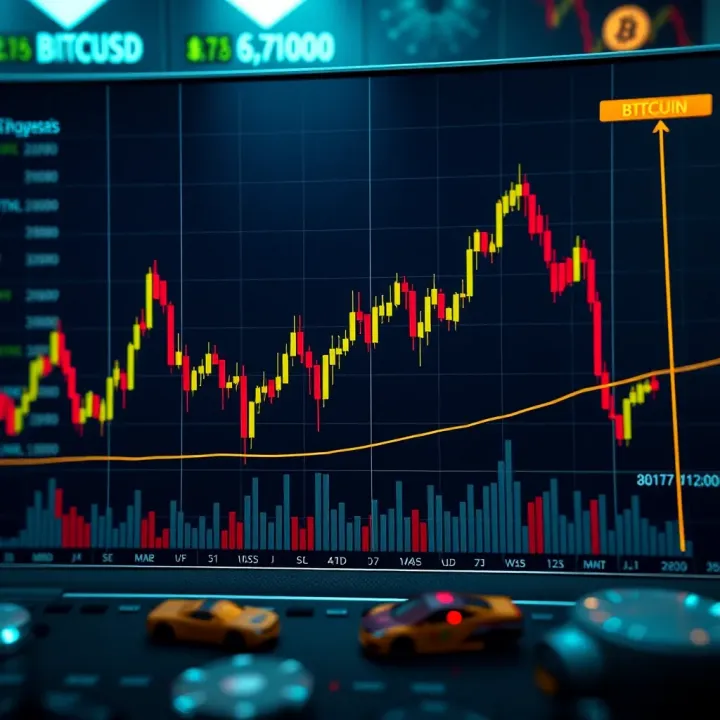
BTCUSD Forecast: Bitcoin Price Outlook Against USD
📈 Get a detailed BTCUSD forecast with Bitcoin trends, key price influencers, technical analysis, and risks. Essential for Indian investors before trading ₹crypto.
Edited By
Amelia Green
Bitcoin (BTC) continues to draw attention as one of the most volatile and widely traded cryptocurrencies globally. Its price against the US dollar (USD) has seen sharp fluctuations that challenge even experienced traders and investors. This section sets the stage for understanding the key patterns and factors shaping BTC/USD price movements in the coming months.
In recent years, Bitcoin's value has been influenced by a mix of global economic shifts, technological upgrades, and regulatory developments. For instance, geopolitical tensions or changes in monetary policy by central banks like the Reserve Bank of India (RBI) or the US Federal Reserve often ripple through crypto markets. Understanding such connections helps investors anticipate price swings before they materialise.

Cryptocurrencies like Bitcoin tend to react strongly not only to market trends but also to news cycles, making timing and awareness critical for anyone keen on trading or investing.
Market indicators such as trading volumes and on-chain data also provide early signals on potential price direction. Technical analysis tools—like moving averages and the Relative Strength Index (RSI)—spot trends or reversals in BTC price momentum. For example, a sustained price above the 200-day moving average might point to bullish momentum, which traders tend to watch closely.
Beyond technical factors, industry developments such as the adoption of Bitcoin by payment platforms or custody solutions introduced by Indian fintech firms can boost confidence and demand. Conversely, stricter crypto regulations in India or abroad may create headwinds.
For Indian investors, the interplay between BTC and USD also means tracking currency valuations and policies. The strength of the rupee against the dollar can affect returns when Bitcoin prices are converted back to INR.
In summary, a blend of technical analysis, market data, and economic context is essential when evaluating BTC/USD price trajectories. This article will explore these elements in detail to offer you grounded insights, vital for navigating this unpredictable but promising market.
Understanding current trends in Bitcoin prices against the US dollar helps traders and investors make better decisions. Since Bitcoin is highly volatile, keeping track of recent movements offers clues about its near-term direction. For instance, during periods of strong momentum, traders might consider short-term buying opportunities, while lapses could signal caution.
Bitcoin has experienced significant swings in value over the past few months. Earlier this year, prices slid sharply from around $48,000 to $34,000 amid global monetary tightening. However, since early 2024, the cryptocurrency has staged a gradual recovery, hovering between $40,000 and $45,000. This rebound follows increased institutional interest and softer inflation data from the US economy. Such fluctuations highlight how external economic factors directly impact BTC/USD rates.
In April 2024, Bitcoin's price showed volatile spikes coinciding with geopolitical tensions and regulatory discussions in major markets like the US and Europe. These events caused rapid shifts, with intraday price changes exceeding 5% on some days. Monitoring these short windows can help sophisticated traders gauge market momentum.
Sentiment plays a strong role in Bitcoin trading, often driving prices more than fundamentals in the short term. Social media buzz, investor confidence, and major announcements trigger swift market responses. For example, when a leading payment platform announced support for Bitcoin transactions recently, positive sentiment pushed prices up 7% within 24 hours.
On the other hand, concerns over regulatory clampdowns, such as possible bans on crypto wallets in certain countries, tend to dampen enthusiasm and cause sell-offs. Likewise, changes in the US Federal Reserve’s policy influence investor risk appetite towards cryptocurrencies.
Other factors shaping sentiment include trading volumes on major exchanges, whale activity (large holders moving coins), and macroeconomic news, such as GDP growth rates and unemployment numbers. Indian investors should watch these closely given the correlations between global economic health and BTC/USD dynamics.
Staying updated on Bitcoin’s price trends and sentiment gives you an edge. It helps spot entry or exit points and avoid unexpected shocks. Combining this knowledge with technical analysis and economic context creates a more comprehensive investment approach.
Understanding the key drivers behind Bitcoin’s price changes is essential for anyone looking to forecast its future value against the US dollar. Price swings are not random but often hinge on economic signals, government regulations, and technological shifts within the crypto ecosystem. Grasping these factors helps investors and traders anticipate market movements and make informed decisions.
Bitcoin behaves partly like a risk asset and partly like digital gold, meaning its price reacts to several global economic cues. Inflation rates worldwide, for example, tend to push investors towards assets seen as inflation hedges, such as Bitcoin. When inflation in major economies like the US or Eurozone picks up, demand for BTC often rises, nudging its price higher against the USD.
Conversely, interest rate hikes by central banks can weigh on Bitcoin's price. For instance, when the US Federal Reserve raises rates, the dollar strengthens, making BTC more expensive for holders of other currencies. This usually triggers price corrections. Another key indicator is the strength of the US dollar index—when the dollar gains, BTC tends to weaken and vice versa.
Bitcoin’s price is highly sensitive to regulatory news. Announcements from countries like the US, China, or India about crypto rules can cause immediate volatility. A common example is the Securities and Exchange Board of India (SEBI) deliberating crypto regulation, which influences Indian investor sentiment heavily.
Stronger regulatory clarity often encourages institutional investment, bringing fresh liquidity and price stability. On the other hand, bans or harsh restrictions might trigger sell-offs. For example, China’s tightening on crypto mining and trading throughout recent years led to significant market dips. Investors must monitor regulatory updates closely as they directly impact demand and market trust.
Technological developments also steer Bitcoin prices. Upgrades like the Taproot soft fork improve privacy and efficiency, which can boost confidence and adoption. Similarly, enhancements in Bitcoin wallet security or more scalable transaction methods increase its real-world usability.
Additionally, integration with emerging payment platforms or wider acceptance among merchants can create positive price momentum. Consider how growing support from platforms like PayPal or Square around 2020 helped Bitcoin break previous price ceilings. Investors should track these changes since they reflect Bitcoin’s evolution from a speculative asset to a more practical financial tool.
To sum up, the BTC/USD price depends on a mix of macroeconomic conditions, regulatory landscapes, and tech progress. Successful traders often watch these drivers carefully to anticipate market moves rather than reacting after the fact.
By staying alert to these forces, you can better navigate Bitcoin’s volatility and seize timely opportunities.
Technical analysis plays a vital role in understanding the likely direction of Bitcoin's price against the US dollar. Unlike fundamental analysis, which studies broader economic and regulatory factors, technical analysis focuses on price history and trading volumes. This helps traders and investors make more informed decisions by identifying patterns and potential turning points in the market.
Chart patterns offer a visual way to anticipate future price moves based on historical data. Familiar patterns like "head and shoulders," "triangles," and "double tops or bottoms" often signal trend reversals or continuations. For example, a broken ascending triangle usually points to a bullish breakout, indicating that Bitcoin’s price might surge soon. Recognising these patterns early can provide a strategic edge.
Alongside patterns, technical indicators like Moving Average Convergence Divergence (MACD), Bollinger Bands, and Volume oscillators help confirm trends or warn of momentum weakening. A sudden spike in volume during an uptrend, for instance, tends to validate the strength of that move. Traders often blend patterns and indicators, creating a balanced approach that minimises false signals.
Moving averages smooth out price fluctuations, making trends easier to spot. The commonly used Simple Moving Average (SMA) or Exponential Moving Average (EMA) over periods like 50, 100, and 200 days help identify support and resistance levels. When Bitcoin's price crosses above the 50-day EMA, it may suggest recovery or bullish momentum; a drop below could warn of a slump.
Relative Strength Index (RSI) is another popular tool, measuring whether Bitcoin is overbought or oversold on a scale from 0 to 100. An RSI above 70 usually indicates the asset might be overbought, hinting at a possible price correction, while below 30 suggests oversold conditions and potential buying opportunities.
Combining moving averages with RSI gives a clearer picture. For example, if Bitcoin’s price moves above its 100-day EMA while RSI reads around 60, it signals steady strength without excessive overheating.
For Indian investors, understanding these technical tools helps navigate Bitcoin's volatile market more confidently. Learning to read charts and indicators can demystify sudden price swings and guide well-timed trading decisions.
In sum, technical analysis offers practical, quantifiable methods for forecasting BTC/USD price action. By mastering chart patterns, moving averages, and RSI, traders position themselves better to anticipate fluctuations and capitalise on market opportunities.
Understanding expert opinions and market predictions holds great value for anyone following Bitcoin's price movements. Financial analysts, crypto experts, and institutional investors study various data points that might not be immediately obvious to a typical trader. Their views help shed light on potential trends, risks, and opportunities, providing a clearer perspective amid Bitcoin's notorious volatility.
Top cryptocurrency analysts often blend technical analysis with fundamental insights to forecast Bitcoin's price trajectory. For example, analysts at Delphi Digital and Glassnode use on-chain data such as wallet activity and miner flows to project price turning points. Recently, some experts predicted Bitcoin could test the ₹50 lakh mark by mid-2024, citing growing institutional adoption and a potential macroeconomic slowdown encouraging alternative investments.
Meanwhile, some analysts at CoinShares caution that market uncertainties—like shifts in US Federal Reserve policies or geopolitical tensions—could limit upward momentum. Their analyses suggest a cautious optimism but highlight the importance of closely watching support levels around ₹30 lakh, which historically act as a psychological anchor.
The cryptocurrency space shows a clear divide between bullish and bearish outlooks on Bitcoin. Bulls argue that Bitcoin’s limited supply, mounting adoption in emerging markets, and increasing integration within traditional finance portfolios point to sustained growth. They point to instances when Indian investors flocked to BTC during currency fluctuations, treating it as a digital hedge.
On the other hand, bears emphasise regulatory crackdowns, potential technological vulnerabilities, and the risk of alternative cryptocurrencies (altcoins) eating into Bitcoin’s market share. They warn that a tightening regulatory stance by the Securities and Exchange Board of India (SEBI) or further clarifications on taxation could temporarily shake investor confidence.
Navigating these contrasting views requires weighing macroeconomic factors alongside domestic policies. Smart investors often use such insights to fine-tune entry or exit points rather than rely solely on one prediction.
In sum, expert forecasts blend data with scenario analyses, while comparing bullish and bearish perspectives equips investors with a balanced view. For those trading or investing in BTC/USD, following these discussions provides practical guidance to anticipate price swings and plan moves accordingly.
Investing in Bitcoin (BTC) from India involves unique challenges and opportunities. Unlike global markets, Indian investors must navigate specific economic policies and regulatory landscapes that directly impact BTC trading. Understanding these elements helps in making informed decisions and mitigates unnecessary risk.
The Reserve Bank of India (RBI) has had a cautious stance on cryptocurrencies. While it has not banned Bitcoin outright, the RBI has issued warnings and placed restrictions on banks interacting with crypto exchanges. For example, in 2018, RBI's circular barred banks from dealing with crypto businesses, which led to many exchanges shutting down or relocating. Though the Supreme Court lifted this ban in 2020, regulatory ambiguity remains.
Taxation also plays a critical role. From FY 2022-23 onwards, the government introduced a 30% tax on gains from virtual digital assets, including Bitcoin, along with a 1% TDS on transactions exceeding ₹10,000. This affects both trading and long-term holding strategies as taxes reduce net returns. Moreover, potential future regulations, like tighter KYC norms or reporting requirements, may impact trading flexibility.
Economic factors such as inflation rates and currency fluctuations influence BTC/USD valuations and consequently the rupee value of Bitcoin investments. For instance, a weakening rupee against the dollar magnifies gains in local currency, but also raises the entry cost when buying BTC priced in USD.
Firstly, choose crypto exchanges regulated within India or those maintaining transparent compliance standards. Platforms like WazirX and CoinDCX offer easier INR deposits and withdrawals, making trading smoother.
Secondly, pay attention to transaction fees and withdrawal limits. Lower fees allow more frequent trading without eroding profits. Also, be aware of timing around tax events to optimise returns and avoid surprises in your Income Tax Return (ITR).
Thirdly, diversify investment amounts—avoid putting a large corpus in Bitcoin at once. Consider staggered buying through systematic investment plans (SIPs) in crypto, reducing exposure to volatility.
Finally, stay updated with news from the Ministry of Finance and RBI notifications about crypto policies. Join Indian crypto communities to exchange insights and learn from others' experiences.
Key takeaway: Indian investors need to blend awareness of local regulations, tax impact, and market dynamics to navigate BTC/USD trading smartly. This reduces risks and helps capture opportunities effectively.
By understanding these factors and applying practical steps, Indian traders and investors can make better decisions in the volatile Bitcoin market while complying with local laws and optimising returns.
📈 Get a detailed BTCUSD forecast with Bitcoin trends, key price influencers, technical analysis, and risks. Essential for Indian investors before trading ₹crypto.
Explore the Binance Coin (BNB) price forecast for 2030 🔮. Understand key factors, market trends, technology updates, and expert views shaping BNB's growth in crypto.

📊 Explore EUR/USD forecasts with insights on economic indicators, market trends & geopolitical factors shaping the pair’s movement—ideal for traders & investors alike.

Explore Bittorrent Coin's journey, key market trends, expert views, and risks to forecast its price potential by 2030. Stay informed on factors shaping BTT's future! 🔍📈
Based on 7 reviews