
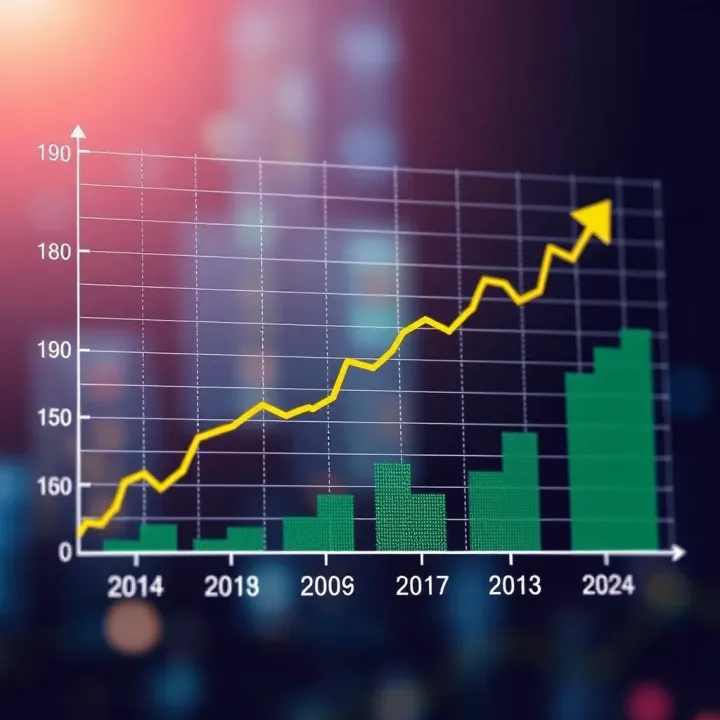
Reliance Industries Target Price Forecast for 2030
📈 Explore Reliance Industries' growth prospects and target price for 2030, analyzing key sectors, market trends, and risks for informed investing decisions.
Edited By
Charlotte Reed
Bitcoin remains one of the most volatile yet watched assets against the US dollar (BTCUSD). Its price swings grab headlines across global markets, but Indian investors need practical insights to navigate these ups and downs effectively. Understanding factors behind Bitcoin's moves helps traders and analysts formulate better strategies and hedge risks well.
The BTCUSD pair reflects the demand for Bitcoin in US dollar terms, influenced by macroeconomic trends, regulatory news, and market sentiment. For instance, tightening monetary policies by the US Federal Reserve tend to push the dollar higher, often putting downward pressure on Bitcoin prices. Conversely, periods of dollar weakness or rising inflation fears can drive investors to seek Bitcoin as a hedge.
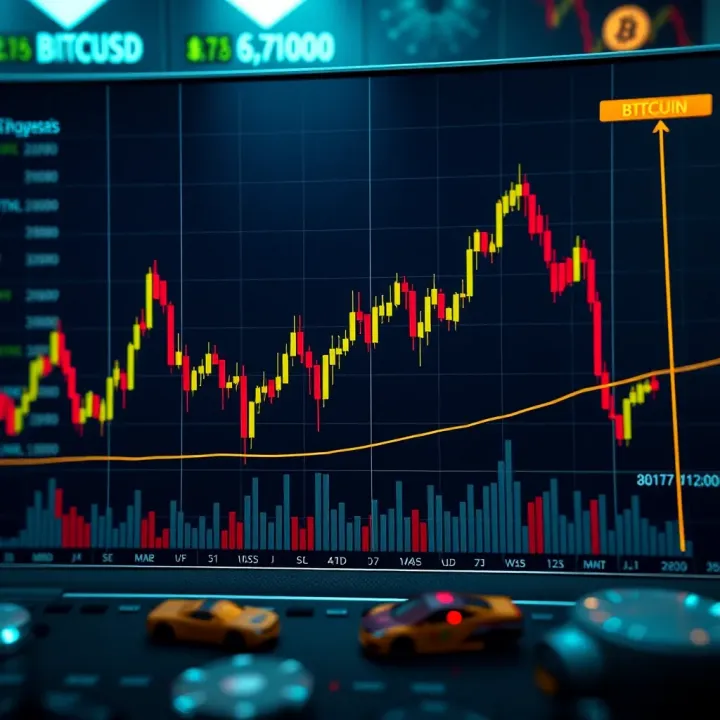
Technical analysis plays a key role in forecasting BTCUSD movements. Indicators like the Relative Strength Index (RSI), moving averages, and Fibonacci retracements offer clues on potential trend reversals or continuation. Indian traders frequently use popular platforms like WazirX and CoinDCX, integrating these technical tools alongside fundamental news to time their trades better.
Investor behaviour is another driver worth highlighting. Large wallets or "whales" can cause sudden price jumps or dips by moving significant quantities of Bitcoin. Also, specific events such as Bitcoin halving, which occurs roughly every four years, historically triggers increased volatility and often sets the stage for price rallies.
Awareness of these interplay factors is particularly important now, given global financial uncertainty and India’s evolving crypto regulations. Informed forecasting can help mitigate risks and capitalise on opportunities.
To sum up, predicting Bitcoin’s price against the US dollar involves examining economic indicators, technical signals, and market psychology. This article will provide a detailed overview to help you, whether a trader or investor, stay ahead in the BTCUSD market.
Understanding the current state of Bitcoin against the US dollar sets a strong foundation for any forecast. It helps traders and investors spot where the market stands today, the trends shaping it, and what factors might influence price movements going forward. For instance, knowing Bitcoin's recent performance and volatility aids in risk assessment and strategy planning, especially for Indian investors who often juggle currency risks alongside asset volatility.
Over the past six months, BTCUSD has seen a rollercoaster ride. Starting the period around $30,000, Bitcoin briefly touched highs above $45,000 before falling back near $28,000. Such swings reflect the ongoing tussle between bullish optimism and profit-taking pressure. This dynamic is vital to keep in mind because it shapes market sentiment and entry points for investors.
Volatility in Bitcoin remains higher than most traditional assets. Trading volumes have fluctuated, often spiking during major news events. For example, announcements from the US Federal Reserve or regulatory developments in China have prompted sudden volume surges. These patterns mean traders should be ready for swift price moves, making stop-loss orders and real-time monitoring essential.
Global macroeconomic events also heavily impact BTCUSD. The delayed US rate hikes combined with inflation concerns and geopolitical tensions, such as ongoing conflicts affecting commodity prices, create uncertainty. This uncertainty often pushes investors into or out of Bitcoin as a perceived hedge or speculative asset. For Indian investors, factors like RBI’s monetary policies and the rupee-dollar exchange rate add another layer of complexity.
Institutional players have increased their footprint in Bitcoin over recent years. Firms like MicroStrategy and Tesla have shown confidence by adding BTC to their balance sheets, which in turn supports price stability and boosts investor trust. This institutional interest signals a maturing market but also introduces sensitivity to regulatory changes and market sentiment.
Retail investors, including those in India, remain a major force. The rise in crypto exchanges such as WazirX and CoinDCX has broadened accessibility, encouraging more participation despite regulatory uncertainties. Indian retail behaviour often shows quick moves around news about crypto legality or taxation, highlighting the need for cautious investment strategies.
Media coverage and social sentiment play a powerful role too. Positive news on adoption or technology upgrades can send prices up sharply, while fear generated by negative news or hacking incidents can lead to quick sell-offs. Social media trends often amplify these sentiments, affecting short-term price behaviour—but traders should separate hype from fundamentals.
Keeping a clear eye on both market data and sentiment helps investors position themselves better in BTCUSD movements. This balance proves especially handy when the market behaves unpredictably.
Understanding the factors that influence the BTCUSD price is vital for making informed investment decisions. These factors include regulatory environments, macroeconomic indicators, and global trends that often drive Bitcoin's price volatility and market sentiment. Let’s take a closer look at how these impact Bitcoin against the US dollar.
Regulations in the US and India shape Bitcoin's market dynamics significantly. In the US, clear guidelines from agencies like the Securities and Exchange Commission (SEC) have made institutional participation more structured, but stringent rules can also trigger price dips. In India, uncertainty remains as crypto regulations are still evolving; frequent government statements and taxation policies influence both retail and institutional adoption. For example, the introduction of a 30% tax on cryptocurrency gains in India has impacted investor enthusiasm, while ongoing discussions about legal frameworks keep the market cautious.
Several regulations are on the table, including potential bans, licencing restrictions, or crypto-specific frameworks. In India, the government is contemplating a comprehensive Crypto Bill that may introduce tighter controls, which could cause short-term jitters. Conversely, proposals to regulate crypto exchanges and introduce consumer protection might boost credibility long-term. The US is reviewing stablecoin regulations and enhancing anti-money laundering norms, likely affecting liquidity and trading volumes.
Policy clarity generally boosts investor confidence by reducing uncertainty, while sudden or harsh changes tend to shake the market. For instance, unexpected bans or restrictive tax measures often lead to sharp sell-offs. Indian investors have reacted in waves whenever government announcements shift, showing a strong correlation between regulatory news and BTCUSD price swings. Staying updated on policy developments helps investors manage risk and time their trades effectively.
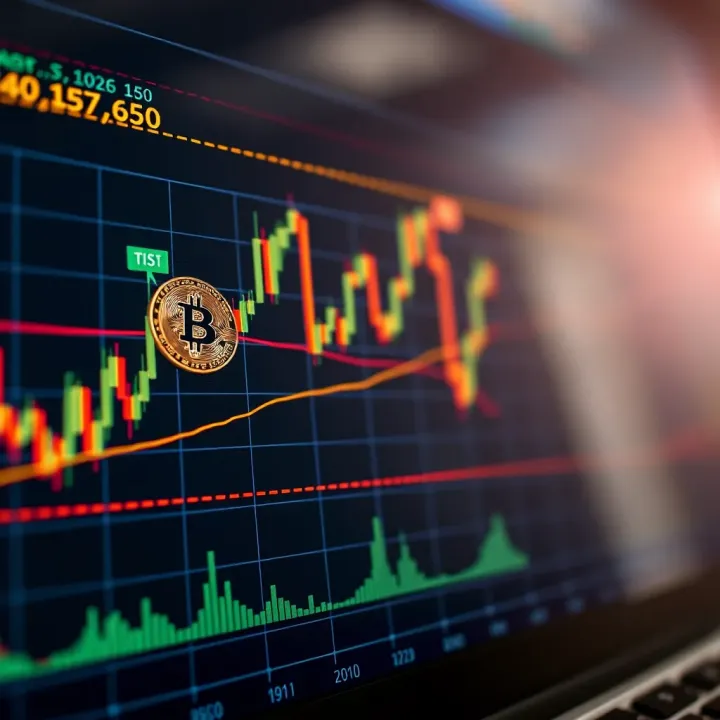
Inflation and interest rate decisions by the Reserve Bank of India (RBI) and the US Federal Reserve (FED) play a direct role in Bitcoin's appeal. High inflation tends to increase demand for Bitcoin as an alternative asset, while rising interest rates can make traditional investments more attractive, putting pressure on BTC prices. For example, recent rate hikes by the FED have contributed to Bitcoin corrections, whereas periods of loose monetary policy often coincided with BTC price rallies.
Bitcoin does not move in isolation; its price correlates with equity markets, commodities like gold, and currency flows. When the US dollar strengthens, BTCUSD often faces downward pressure since Bitcoin trades against the dollar. Indian investors should watch these correlations closely, especially during volatile times when capital flows shift between markets. For instance, during geopolitical tensions, investors may flock to safe-haven assets, temporarily reducing Bitcoin's demand.
Global political instability, trade wars, or supply chain hiccups impact market confidence and liquidity, indirectly influencing BTC prices. For example, tensions affecting semiconductor supplies can slow down mining hardware production, thereby impacting Bitcoin’s network and investor sentiment. Similarly, geopolitical conflicts affecting key economies can cause shifts in investment priorities, leading to increased volatility in BTCUSD.
Keeping track of these economic and policy factors allows traders and investors to better anticipate Bitcoin’s price movements and make strategic decisions amid global uncertainty.
Always consider the combined effect of regulatory news and macroeconomic indicators
Monitor RBI and FED announcements for clues about market trends
Be cautious during periods of geopolitical unrest or unexpected supply chain issues
Technical analysis provides invaluable tools for understanding BTCUSD price movements. Traders and investors use chart patterns, indicators, and signals to form an evidence-based outlook, rather than relying purely on speculation. This approach helps identify entry and exit points, set realistic price targets, and manage risk more effectively.
Support and resistance represent price points where Bitcoin tends to find buying or selling pressure, respectively. For instance, if BTC consistently rebounds near ₹15 lakh, this acts as a support level signalling demand. Conversely, ₹20 lakh may serve as resistance where selling often emerges. Recognising these levels allows traders to anticipate potential price reversals or breakouts, which is crucial for making buy or sell decisions.
Moving averages smooth out short-term price fluctuations to reveal prevailing trends. Common examples include the 50-day and 200-day moving averages. When Bitcoin’s price crosses above these averages, it often signals bullish momentum; crossing below might indicate bearishness. Trend lines, drawn connecting recent highs or lows, provide additional context on price direction. Together, these tools guide traders on whether the market sentiment is strengthening or weakening.
Momentum indicators like the Relative Strength Index (RSI) and Moving Average Convergence Divergence (MACD) measure the speed and strength of price changes. An RSI above 70 suggests Bitcoin is overbought and may face a correction soon, while below 30 indicates oversold conditions. MACD crossovers can signal trend shifts, helping traders time entries or exits more precisely. Applying these indicators prevents getting caught in false signals and improves timing.
Technical signals assist in setting realistic short-term targets (days to weeks) and medium-term targets (weeks to months). For instance, if Bitcoin breaches a key resistance at ₹20 lakh accompanied by high volume, the next target might be ₹22 lakh. On the other hand, if the price stalls near a moving average, a pullback to ₹18 lakh could occur. Clear targets help investors plan their trades and manage expectations.
Trading volume confirms the strength behind price moves. A breakout accompanied by rising volume usually suggests sustained momentum. Candle patterns, such as a doji or hammer, reveal market indecision or potential reversals. For example, a hammer appearing near a support level can signal a bullish turn. Combined analysis of volume and candle shapes refines entry and exit timing.
Technical setups often hint at possible breakouts or corrections. If BTCUSD forms a triangle pattern with narrowing price range, a breakout either upward or downward is expected soon. Conversely, an extended rally with weakening momentum could indicate an upcoming correction. Recognising these scenarios helps traders position themselves to benefit from moves or protect capital from downside risks.
Technical analysis is not a crystal ball but a practical toolkit. Properly applied, it enhances decision-making in volatile markets like Bitcoin, especially for those trading against the US dollar.
By focusing on these technical insights, investors can better navigate BTCUSD’s unpredictable swings and plan strategies accordingly.
Understanding the risks and challenges in forecasting BTCUSD is key for traders and investors aiming to navigate Bitcoin's often erratic market. The cryptocurrency's price is sensitive to sudden changes, both external and internal to the market, making precise predictions tricky. A real grasp of these issues helps in forming strategies that balance opportunity with caution.
Regulatory changes can shake the crypto market abruptly. For example, when the US Securities and Exchange Commission (SEC) announces crackdowns or delays in approving Bitcoin exchange-traded funds (ETFs), BTC often dips quickly. Such announcements create confusion as investors rush to adjust their positions, especially in India where digital asset regulation is still evolving. Traders need to watch out for government notifications, as even rumours can trigger significant price swings.
Security breaches at major exchanges or wallets often cause instant panic selling. The 2019 Binance hack, which saw over $40 million stolen, led to a sharp drop in Bitcoin’s price globally. For Indian investors, where security awareness is growing but still developing, such events highlight the importance of safe custody practices. These incidents momentarily undermine confidence across markets, making price movements hard to predict during crisis.
When so-called 'whales'—investors who hold vast amounts of Bitcoin—decide to sell or move large holdings, the price can fluctuate wildly. For instance, a single whale offloading a few thousand BTC can cause others to panic sell, spiralling the market downwards. Tracking these large movements has become a part of analysis, but predicting their timing remains difficult. Indian investors should thus be wary of sudden, unexplained volume spikes as signals of possible volatility.
Investor sentiment plays a massive role in crypto prices but is incredibly tough to quantify in models. Fear and greed often drive decisions more than fundamentals. Take the FOMO (fear of missing out) seen during Bitcoin rallies: it pushes prices beyond typical valuations. Conversely, panic during global crises can cause crashes. These emotional and psychological factors limit the accuracy of purely numerical forecast tools.
Technical indicators like RSI, MACD, and moving averages aid in spotting trends, yet they can mislead in Bitcoin’s volatile environment. Sudden market news or whale activity can invalidate these signals quickly. Unlike stocks, Bitcoin trades 24/7 globally, adding layers of unpredictability and noise. Indian traders should combine technical insights with news awareness rather than rely on charts alone.
Events like geopolitical conflicts, natural disasters disrupting technology infrastructure, or major hacks can impact BTC prices without warning. For instance, the Russia-Ukraine conflict caused temporary spikes in crypto use due to sanctions, altering demand unpredictably. These factors lie outside traditional financial models but can sway Bitcoin markets sharply, complicating forecasting efforts.
A cautious approach, recognising these risks, allows investors to better manage the uncertainties of BTCUSD trading.
This section bridges the gap between BTCUSD market analysis and practical application, helping traders and investors convert insights into effective strategies. Understanding how to manage risk, allocate capital, and spot investment opportunities can protect from sudden market swings and improve returns, especially relevant for Indian participants facing unique regulatory and market conditions.
Suggested strategies appropriate for Indian investors: Indian investors should approach Bitcoin trading with careful position sizing considering their overall portfolio and risk tolerance. Given Bitcoin’s volatility, limiting exposure to 5-10% of total investments can avoid overconcentration. For example, if your portfolio is ₹20 lakh, keeping Bitcoin investment within ₹1-2 lakh helps better absorb price shocks. Meanwhile, using smaller, incremental entries can reduce the impact of short-term fluctuations.
Use of stop-loss and profit booking: Employing stop-loss orders is crucial to cut losses when BTCUSD moves unfavourably. Traders in India can set stop-loss at 5-8% below their entry price to protect capital in a volatile market. Additionally, booking profits in stages rather than waiting for a full target price helps lock gains while leaving room to benefit from further upside. For example, selling 40% of holdings after a 15% rise and the rest later can improve risk-adjusted returns.
Importance of diversification in portfolios: Diversifying beyond Bitcoin into other asset classes like equities, fixed deposits, and gold smoothens overall portfolio volatility. Many Indian investors traditionally turn to gold as a hedge; adding crypto alongside reduces dependency on any one asset. Within crypto itself, diversifying across coins like Ethereum or Binance Coin may lower risk compared to holding Bitcoin alone.
Potential for Bitcoin as a hedge: Bitcoin’s limited supply and independence from traditional financial systems position it as a hedge against inflation and currency depreciation. In India, where inflation can fluctuate, Bitcoin offers an alternative store of value. Although volatile, it can protect wealth over the long term when used judiciously alongside other hedging options such as real estate or gold.
Role in a balanced investment plan: Incorporating Bitcoin into a well-rounded investment strategy adds potential growth while balancing risk. For instance, retirees or conservative investors might allocate a small portion, say 2-5%, to Bitcoin, complementing safer fixed-income assets. This balanced approach accommodates Bitcoin’s growth potential while mitigating its abrupt price swings.
Impact of technological development and adoption: The pace of Bitcoin adoption and upgrades in blockchain technology will influence its future price trajectory. Indian companies and startups integrating Bitcoin payments or decentralised finance (DeFi) services boost practical use cases beyond speculation. Increasing infrastructure, such as UPI-enabled crypto exchanges, can widen access and encourage institutional involvement, bolstering demand and stability.
Traders and investors benefit most by tailoring their Bitcoin strategies to personal risk capacity and market conditions, staying flexible to evolving regulatory and technological landscapes.
📈 Explore Reliance Industries' growth prospects and target price for 2030, analyzing key sectors, market trends, and risks for informed investing decisions.
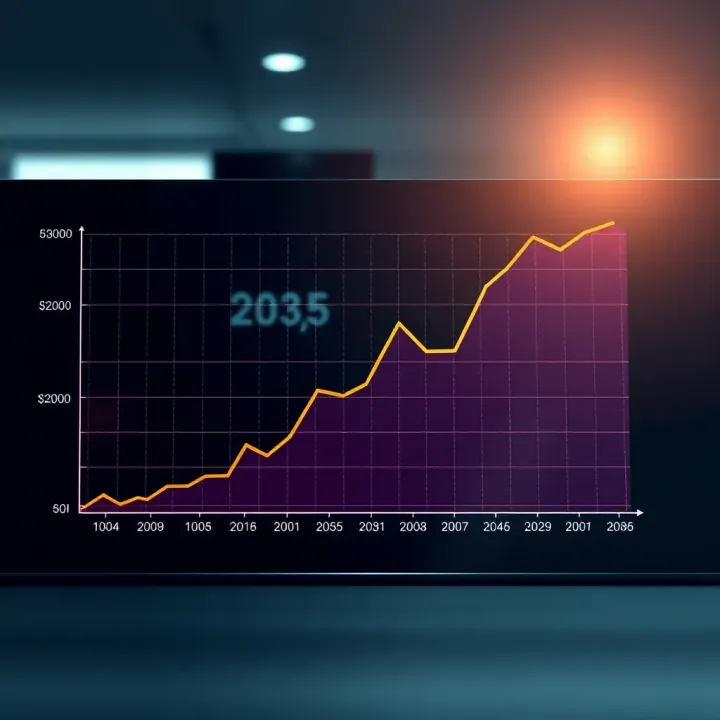
📈 Dive into our detailed analysis of Reliance share price target for 2035, exploring company fundamentals, market trends, risks, and expert views for informed investing.

📈 Explore RCOM's share price outlook for 2030 with in-depth analysis of market trends, financial health, and expert forecasts tailored for Indian investors.
📈 Explore Reliance Industries' share price forecast for 2025, analyzing recent trends, market influences, expert views, and key risks for investors.
Based on 12 reviews