

Understanding Qutex Trading: A Clear Guide
Explore Qutex trading 📈 with this detailed guide—learn core concepts, setup, execution & risk management to trade smartly in India’s market 🇮🇳.
Edited By
Edward Clarke
Fibonacci ratios are widely used in trading to pinpoint key levels where prices are likely to pause or reverse. These levels often act as support or resistance, which helps traders plan entries and exits with better precision. Understanding how these ratios arise from the famous Fibonacci sequence provides a solid foundation for applying them wisely in markets.
The Fibonacci sequence itself starts with 0 and 1, and each following number is the sum of the previous two—like 0, 1, 1, 2, 3, 5, 8, 13, and so on. What makes these numbers special in trading is the ratios between them; for example, the ratio 61.8% (or 0.618), known as the golden ratio, appears frequently in price movements.
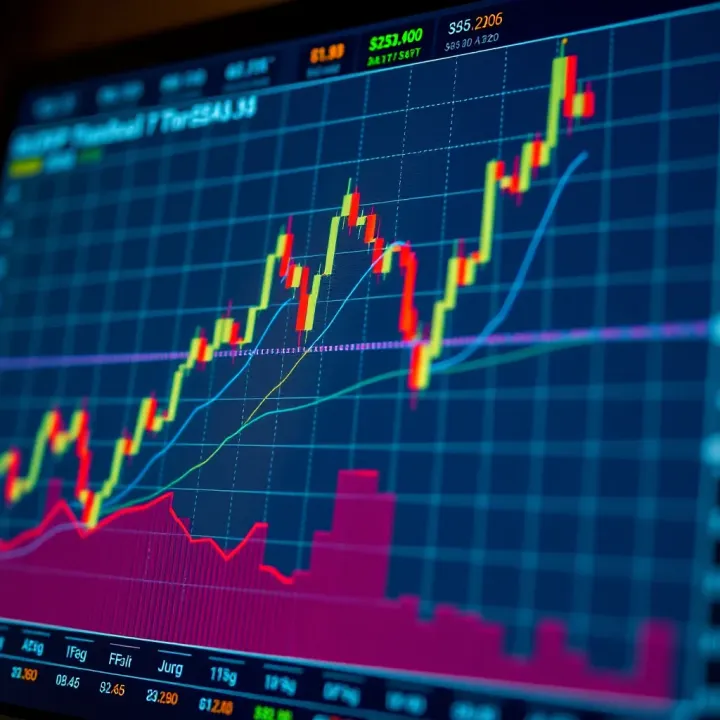
Traders use tools such as Fibonacci retracements and extensions based on these ratios. Retracement levels help identify likely pullback zones in a trending market—for instance, watching price retrace to 38.2%, 50%, or 61.8% before resuming its original direction. Extensions forecast possible target prices beyond recent highs or lows.
Using Fibonacci levels isn't foolproof but combining them with other indicators like volume or trendlines enhances reliability.
Here’s how you can start applying Fibonacci tools practically:
Identify a significant high and low on your chart (daily or hourly).
Draw Fibonacci retracements between these points to highlight key zones.
Observe price reactions around these levels to gauge strength or weakness.
Use extensions to anticipate future moves and set stop-loss or target points.
For example, if Nifty50 rallies from 15,000 to 16,000, a 50% retracement at 15,500 may offer solid support. Watching how price behaves near this zone can guide you whether to enter a long trade or wait.
Overall, Fibonacci analysis helps to spot potential turning points quickly, making it a valuable part of any trader’s toolkit. It requires practice and context—knowing market conditions and confirming signals before making decisions.
Next sections will explore each Fibonacci tool in detail and show real-world trading setups using these levels.
Understanding Fibonacci numbers and levels helps traders identify potential support and resistance points clearly. These ratios often highlight price levels where the market might pause or reverse, giving traders a practical edge in planning entries or exits. In markets like the Sensex or Nifty, recognising these key levels becomes especially useful during volatile sessions.
The Fibonacci sequence originated from a 13th-century mathematician, Leonardo Fibonacci, who observed a pattern where each number is the sum of the two preceding ones. While it started as a curiosity related to breeding rabbits, its application reaches far beyond, especially in financial markets.
In trading, the focus is less on the sequence itself and more on the ratios derived from it—particularly 0.618, 0.382, and 0.236. These percentages represent how far a market price might retrace before continuing in the original direction, known as Fibonacci retracement levels.
The psychological appeal of Fibonacci lies in its frequent appearance in natural forms—like flower petals or seashell spirals—making it feel intuitive even in human behaviour and decision-making patterns. Traders, consciously or not, tend to react around these levels, which often translates to self-fulfilling price action.
Identifying potential turning points through Fibonacci levels allows traders to anticipate where a price might halt or reverse. For example, if a stock in the Nifty index rises sharply before pulling back, a retracement to the 61.8% level often serves as a key support where buyers might return.
Fibonacci’s link to natural patterns also reflects in market behaviour. Just as nature follows these proportions, markets seem to follow them because human emotions—fear, greed, optimism—often move collectively. This connection helps traders interpret charts beyond just numbers, blending mathematical ratios with crowd psychology for better timing.
Using Fibonacci is not foolproof, but it works well when combined with other tools like moving averages or volume analysis, improving a trader’s sense of likely market moves.
This section lays the groundwork for understanding how Fibonacci levels aid in trading by providing a straightforward method to spot likely price points where trends could shift, all grounded in a mathematical pattern seen repeatedly in nature and human choices.
Fibonacci tools are essential for traders who want to spot potential reversal points or target price levels with more confidence. These tools help translate the abstract Fibonacci ratios into actionable support and resistance levels on price charts. Traders rely on these levels in both trending and sideways markets, using them to plan entries, exits, and stop-loss placements.
Fibonacci retracement levels are drawn by identifying a significant high and low on the chart, which forms the basis for calculating potential retracement points. The idea is that after a sharp rise or fall, prices often pull back a certain percentage before continuing in the original direction. For instance, if the Nifty 50 index rallies from 15,000 to 16,000, traders would apply retracement levels between these two points to find where a pullback might end.
These retracement levels act as horizontal lines on the chart, marking probable zones of support and resistance. When the price approaches these lines, traders watch for reactions such as consolidation, bounce, or reversal. This tactical placement aids in timing trades and avoiding premature entries.
The widely used Fibonacci retracement levels include 23.6%, 38.2%, 50%, 61.8%, and 78.6%. Among these, the 38.2% and 61.8% levels are most closely watched. The 61.8% level, often called the "golden ratio," reflects a strong correction where a bounce or reversal frequently occurs. Meanwhile, 50% is not a Fibonacci ratio per se but remains popular because markets often retrace half of a move.
Spotting a retracement near these key levels provides traders with clues about market sentiment. For example, during volatile sessions in the Sensex, prices often stall or reverse near the 61.8% retracement, signalling a potential entry for a long or short position.
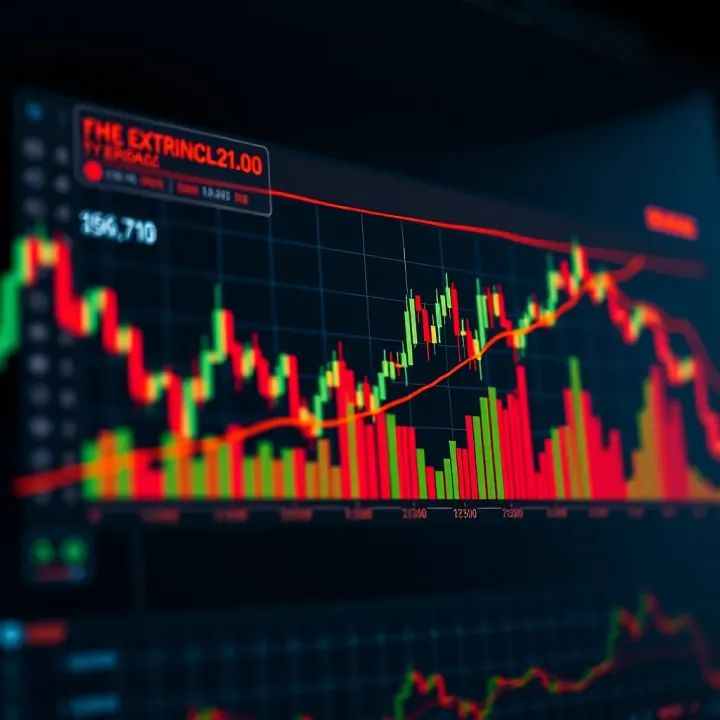
While retracements measure pullbacks within an original move, Fibonacci extensions help project price targets beyond previous highs or lows. Extensions come into play after a retracement finishes and the trend resumes. They indicate where the price may reach next, beyond the original range.
For instance, once the price bounces off a 38.2% retracement, traders might use extension levels to estimate where the trend will take the price, such as 161.8% or 261.8% of the initial move's length. This distinction is vital because retracements set entry or stop zones, whereas extensions assist in target-setting strategies.
Extensions help traders set realistic profit targets during trending markets. If a stock like Reliance Industries zooms from ₹2,000 to ₹2,500 and then pulls back to ₹2,300 (near a retracement level), extensions projected from these points guide traders where to book profits, say at ₹2,700 (161.8% level).
Such targets allow disciplined exits and prevent greed-driven decisions. In the Indian context, many traders combine extensions with other indicators like volume spikes to confirm the sustainability of target zones.
Fibonacci arcs, fans, and time zones are variations of Fibonacci tools that add a geometric angle to support and resistance analysis. Arcs draw curved lines indicating potential support or resistance as price moves in time and space. Fans consist of trendlines radiating from a point, suggesting angles of retracement or extension.
Time zones use Fibonacci ratios to estimate important time intervals for potential market changes. While less popular than retracements or extensions, these tools can help visual traders assess the timing and strength of reversals.
Each Fibonacci tool suits different market scenarios. Retracements work well during clear pullbacks, while extensions suit strong trending phases. Arcs and fans can aid in markets with gradual, steady moves, offering dynamic support or resistance levels.
For Indian traders, choosing the right tool depends on market volatility, timeframe, and trading style. A day trader focusing on short-term swings may prefer retracements, while a position trader may find extensions and time zones more useful for setting longer-term targets.
Using the appropriate Fibonacci tool at the right moment can enhance your trading precision and risk control, particularly in India's diverse and often volatile markets.
Fibonacci analysis becomes much more effective when integrated thoughtfully within a broader trading strategy. By combining Fibonacci levels with other technical tools and real market insights, traders can refine entry and exit points, improve timing, and reduce false signals. This section highlights how you can merge Fibonacci with additional indicators and explores practical instances in Indian markets where these techniques have proved useful.
Moving averages and the Relative Strength Index (RSI) pair well with Fibonacci to enhance decision-making. For instance, if a stock retraces to a 61.8% Fibonacci level near its 50-day moving average, this convergence strengthens that point as support or resistance. Traders often look for RSI to confirm momentum; an oversold RSI near a Fibonacci retracement signals a potential buying opportunity. This combination helps avoid trades purely based on Fibonacci levels, reducing risk.
Volume and price action provide crucial confirmation to Fibonacci signals. Increased volume around a Fibonacci level can indicate stronger market conviction, making the level more likely to hold. Likewise, watching candlestick patterns or price behaviour—like a hammer or engulfing pattern—at key Fibonacci levels helps validate reversals. In Indian markets, where volatility spikes in specific sessions, these signals protect against chasing false breakouts.
Fibonacci tools find regular use among traders dealing with benchmark indices like Sensex and Nifty. Both indices exhibit well-defined swings where retracement levels often align with past support and resistance zones. For example, during a market correction in the Sensex, many traders watch the 50% retracement near 55,000 points as a critical zone to accumulate or exit positions. This practical approach helps maintain discipline amid market noise.
Consider a volatile trading day on the Nifty when the index swings sharply due to earnings announcements or global cues. Using Fibonacci retracement levels on such intraday charts allows traders to spot pullback zones and set targets more precisely. In one case, a trader identified the 38.2% retracement during a morning fall and used it as an entry point, riding the bounce for a quick profit before the next swing. This highlights how retracements serve as practical guides even during erratic market movements.
Combining Fibonacci with other indicators and real-time market data sharpens your trading edge. It's not just about drawing lines but confirming signals through multiple perspectives.
Applying Fibonacci levels requires attention to context, such as the timeframe and market sentiment. By merging these levels with moving averages, RSI, volume, and price action, you can build strategies that respond better to Indian market conditions and volatility patterns.
Understanding both the strengths and limitations of Fibonacci trading is key to using it effectively. While the tool offers practical benefits in pinpointing potential price levels, being aware of its drawbacks helps you avoid common pitfalls that can hurt your trading decisions.
Fibonacci levels help traders identify precise points where price might reverse or stall. Since these levels often coincide with psychological support and resistance zones, they can improve timing entry and exit decisions. For instance, if a stock on the NSE retraces about 61.8% of its recent upward move, this level could signal a good buying opportunity before prices resume their trend.
This method avoids guessing roughly where the market might change direction and instead provides concrete reference points. This enhanced precision is especially useful for intraday traders and swing traders in markets like the Sensex and Nifty, where timing is critical.
Fibonacci tools are simple to draw on any charting platform, requiring just two points to establish key retracement levels. This simplicity means traders across the globe, including India, use and respect these levels. This widespread recognition means that price often reacts at these points, partly because many traders watch the same levels.
Moreover, platforms like Zerodha and Upstox include built-in Fibonacci drawing tools, making it accessible for beginners and experienced traders alike. This easy adoption helps Fibonacci remain a popular technique in the Indian trading community.
One common mistake is depending entirely on Fibonacci levels without seeking confirming signals. While these levels highlight potential zones of support or resistance, they do not guarantee a reversal. Traders ignoring volume trends, candlestick patterns, or momentum indicators like RSI when price approaches Fibonacci levels expose themselves to false signals.
For example, if a Nifty stock reaches its 50% retracement but shows declining volume and weak price action, the reversal might not hold. Without confirmation, acting solely on Fibonacci points can lead to premature entries or exits.
Another challenge lies in choosing the right swing highs and lows from which to draw Fibonacci levels. Two traders might select different points, leading to slightly different retracement values. This subjectivity means that decisions can vary based on how you identify these points, especially in choppy or sideways markets.
In Indian markets, where volatility can spike during earnings seasons or policy announcements, a slight misjudgement in drawing Fibonacci levels might cause a trader to miss crucial turning points. Hence, practising consistency in choosing anchor points and combining these levels with other tools is essential to counter this limitation.
Fibonacci trading works best when used alongside other techniques and with a clear understanding of its boundaries. Recognising its strengths and respecting its limitations can sharpen your market analysis and enhance your trading results.
Using Fibonacci levels effectively requires more than just drawing lines on a chart. Careful selection of key points and understanding the timeframe context can greatly improve the accuracy of your analysis. Alongside this, managing risk appropriately when trading based on Fibonacci levels helps protect your capital and keeps your strategy sustainable.
Selecting the right swing high and swing low is crucial for reliable Fibonacci retracement and extension levels. For example, when analysing the Nifty 50, use prominent peaks and troughs that represent significant market turns, not minor fluctuations caused by noise. Drawing from a recent major low to a high in an uptrend gives more relevant support levels compared to arbitrary points.
Avoid using too narrow or overly broad ranges because these distort retracement levels and lead to misleading signals. A trader spotting a clear trend reversal on the BSE Sensex should anchor the Fibonacci retracement to the highest and lowest points of that trend only.
Fibonacci levels vary depending on the timeframe chosen. Levels drawn on daily charts carry different weight compared to those on 15-minute intraday charts. Generally, longer timeframes provide stronger support and resistance levels. For instance, a retracement level on a weekly chart in Axis Bank’s stock tends to be more respected than one on a 5-minute chart.
That said, traders focusing on short-term trading or day trading should still use Fibonacci on lower timeframes but should confirm signals with volume and price action to avoid false breakouts. Adjusting levels for the timeframe ensures the Fibonacci analysis aligns with your trading style and objectives.
Placing stop-loss orders just beyond key Fibonacci retracement or extension levels limits potential losses if the market moves against you. For example, if you enter a long position near the 61.8% retracement in Tata Motors after a correction, setting a stop-loss slightly below that level cushions against a deeper pullback.
Stop-loss placement should account for market volatility; wider stops might be needed during highly fluctuating sessions like earnings announcements. This protects your position but keeps you in the trade unless the price decisively breaches the Fibonacci support or resistance.
Fibonacci signals alone shouldn’t dictate your entire risk exposure. Combine them with your broader money management rules such as position sizing and risk-reward ratios. For instance, if your portfolio risks 2% on each trade, calculate position size accordingly when targeting Fibonacci extension levels for profit.
This integration prevents overexposure to single trades based on Fibonacci, balancing potential gains with controlled risk. Successful traders in Indian markets like Reliance Industries and Infosys often plan their trades holistically — mixing technical signals with strict money management to avoid large drawdowns.
Investing effort in precise Fibonacci drawing and disciplined risk control turns these levels from simple lines into useful trading tools. Don’t treat Fibonacci as a standalone solution but as part of a bigger strategic framework.
By applying these tips, your trading with Fibonacci levels gains clarity, practical edge, and sustainable risk handling that adapts well to Indian market conditions.
Explore Qutex trading 📈 with this detailed guide—learn core concepts, setup, execution & risk management to trade smartly in India’s market 🇮🇳.
📈 Understand Quotex trading hours in India! Learn market timings, timezone tips, and maximize your trading strategy with detailed insights tailored for Indian traders.
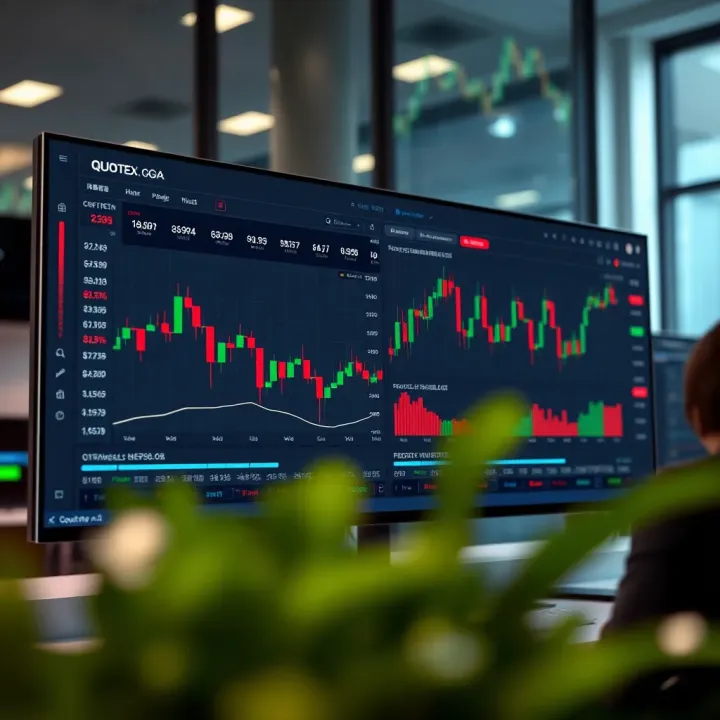
📈 Explore Quotex trading essentials, from platform features to risk management tips, helping Indian traders start smart and trade confidently.
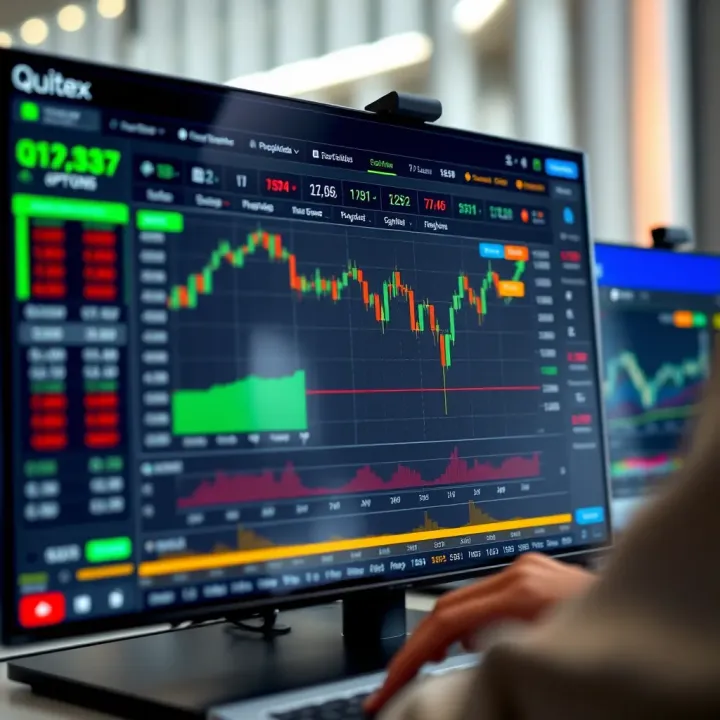
📈 Discover how to trade on Quotex in India with our detailed guide. Learn platform features, set up accounts, choose instruments, and manage risks smartly.
Based on 5 reviews