

Guide to E-Book Trading in India
📚 Explore e-book trading in India: buy, sell, and exchange digital books legally on key platforms, learn copyright rules, and enjoy diverse reading affordably.
Edited By
Emily Carter
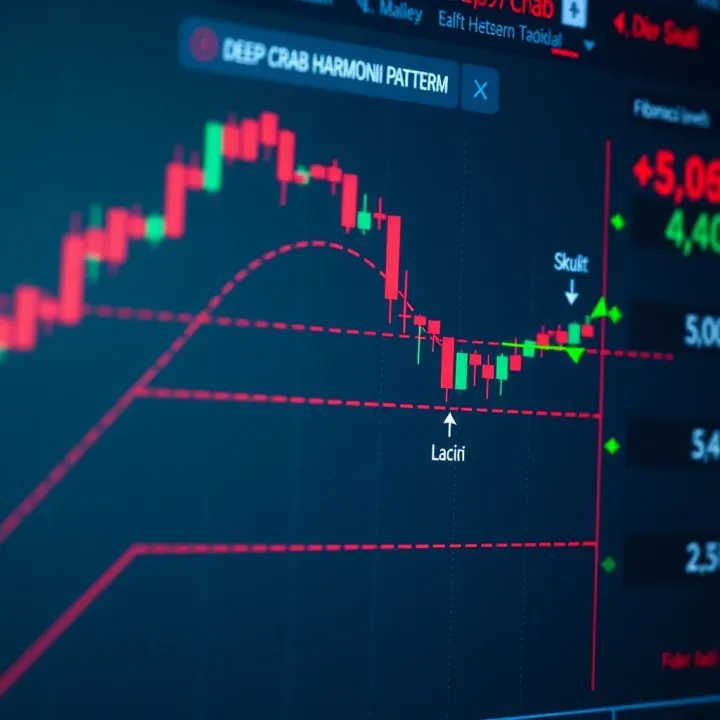
The deep crab pattern is a refined technical setup used by traders to spot potential price reversals with better precision. Rooted in harmonic trading principles, this pattern helps identify exact turning points by combining Fibonacci ratios and geometric price movements.
Unlike common price patterns, the deep crab is distinctive due to its extended retracement levels. Its key feature lies in the sharp extension beyond the typical range, particularly the 161.8% Fibonacci extension of the preceding leg. This helps traders spot when the market might overextend and prepare for a bounce or reversal.

Recognising the deep crab pattern involves studying five critical price points — X, A, B, C, and D — with point D representing the reversal zone. Indian traders often use advanced charting platforms like TradingView or Zerodha's Kite to mark these points precisely. Since the pattern depends heavily on Fibonacci levels, having a clear understanding of these ratios is essential to apply the deep crab confidently.
The pattern provides a measurable setup that supports risk management by offering clear entry, stop-loss, and target levels.
For example, if Nifty 50 forms a deep crab pattern during a downtrend, traders might pinpoint a reversal near the 161.8% extension of the BC leg, setting buy orders just above this level with a stop-loss slightly below. This concrete approach allows better control over risk compared to guesswork or reactive trading.
It’s worth noting that while harmonic patterns like the deep crab add structure to trading decisions, they work best alongside other technical tools. Traders often combine RSI (Relative Strength Index) or MACD (Moving Average Convergence Divergence) indicators to confirm momentum shifts before entering trades based on the pattern.
In India’s dynamic markets — be it equities, commodities, or currency futures — the deep crab pattern, when identified correctly, can offer valuable signals. Familiarity with this pattern enriches your trading strategy by adding a mathematically grounded way to forecast potential market reversals and manage trades systematically.
The Deep Crab pattern holds a significant place among harmonic trading tools, especially for traders aiming to spot sharp market reversals. Understanding this pattern helps investors decode complex price movements and identify turning points that may not be obvious through standard technical analysis. Indian traders—whether dealing in equities, commodities, or currency markets—can benefit from recognising this pattern as it provides timely entry and exit signals, potentially improving returns.
At its core, the Deep Crab pattern is a four-legged harmonic structure, composed of price swings labelled XA, AB, BC, and CD. What sets it apart is the unusually deep retracement at the BC leg, often between 88.6% to 100% of the AB leg, followed by an extended CD leg which reaches a 161.8% Fibonacci extension of the XA leg. This precise relationship between waves helps traders forecast reversals with higher probability. For example, in the Indian stock market, a sudden plunge in a stock like Reliance Industries after completing this pattern might indicate an upcoming upward reversal, offering a strategic buying opportunity.
Introduced by Scott Carney in the early 2000s, the Deep Crab pattern quickly gained traction in the global trading community. Its popularity stems from its accuracy in predicting significant price reversals compared to traditional patterns. In Indian trading circles, this pattern has found favour particularly with day traders and swing traders. Many rely on it alongside tools like Relative Strength Index (RSI) or Moving Average Convergence Divergence (MACD) to confirm signals, especially in volatile markets like the Nifty 50 index. The growing access to charting platforms such as Kite by Zerodha and Upstox Pro further fuels its adaptation among Indian investors.
Mastering the Deep Crab pattern equips you with a powerful lens to anticipate market turns early, enabling better-timed trades and disciplined risk management.
Together, these basics establish the foundation for navigating the deep crab pattern’s applications and help set realistic expectations for its outcomes in your trading journey.
The Deep Crab pattern stands out among harmonic patterns because of its specific price points and strict Fibonacci ratios. It helps traders anticipate sharp market reversals with high precision, a useful edge in volatile markets like India’s. Understanding its structure ensures traders can accurately identify valid setups and avoid misleading signals.
The Deep Crab pattern is defined primarily by the unique role of Fibonacci ratios. Unlike some harmonic patterns, this one’s defining feature is an extended CD leg, often stretching to a 1.618 Fibonacci extension of the XA leg. This particular ratio signals a potential strong reversal. For instance, if the XA move covers 100 points, the CD retracement would extend roughly to 161.8 points.
Other critical Fibonacci levels include:
The AB leg should retrace between 0.382 and 0.618 of XA.
The BC leg often retraces between 0.382 and 0.886 of AB.
The ultimate CD leg completes the pattern near the 1.618 extension of XA.
These price points aren’t random but reflect mathematically consistent ratios traders trust for spotting turning points. This mathematical precision helps to distinguish Deep Crab patterns from regular price swings.
The Deep Crab pattern forms through four distinct legs:
XA: The initial move sets the base. It can be either an upward or downward price swing.
AB: A pullback that retraces a part of XA, ideally between 38.2% to 61.8%.
BC: A corrective wave that moves back toward the direction of XA, typically retracing 38.2% to 88.6% of AB.
CD: The final and longest leg, extending beyond point X to approximately 161.8% of XA.
This extended CD leg is the Deep Crab’s hallmark and often signals exhaustion in the prevailing trend. For example, in a rising market, the price might surge, then retrace (AB), bounce back (BC), and then dive sharply below the starting XA point to complete the pattern.
Recognising these legs clearly prevents false pattern identification. Traders often overlay Fibonacci levels on charts for exact measurement, using trading platforms popular in India such as Zerodha Kite or Upstox Pro.
Identifying precise price points and Fibonacci levels in the Deep Crab pattern brings clarity in complex market moves, allowing Indian traders to tackle volatility with methodical confidence.
By mastering these structural features and ratios, traders tap into a reliable way to predict price reversals and improve timing their entries and exits effectively.
Spotting the deep crab pattern accurately can give you an edge in predicting significant market reversals. This pattern is distinctive because of the exaggerated price extension seen in the CD leg, often beyond standard Fibonacci levels seen in other harmonic patterns. Knowing how to identify it on market charts helps you pinpoint precise entry and exit points, improving trade timing and risk management.
The deep crab pattern typically emerges over intermediate to longer timeframes, such as the 4-hour, daily, and weekly charts. Shorter timeframes like 5-minute or 15-minute charts often show too much noise, which makes pattern recognition tricky. For example, a trader looking at the Nifty 50 daily chart may spot a deep crab pattern forming over several weeks, signalling a potential reversal zone. However, intraday traders focusing on 15-minute windows might struggle to catch this pattern reliably due to erratic price movements.
Focusing on these broader timeframes also allows you to align the pattern with larger market trends, which is crucial since the deep crab’s signal usually relates to significant reversals rather than minor pullbacks. That said, combining multiple timeframes by confirming a pattern on a higher timeframe and zooming into lower timeframes for trade execution works well.
Identifying the deep crab relies heavily on analysing Fibonacci ratios. Traders use Fibonacci retracement and extension tools to measure the legs XA, AB, BC, and CD accurately. The defining feature is the CD leg extension, reaching 161.8% or more of the XA leg, which sets the deep crab apart from other harmonic patterns.
Besides Fibonacci tools, some traders incorporate oscillators like the Relative Strength Index (RSI) or the Moving Average Convergence Divergence (MACD). These indicators can highlight overbought or oversold conditions, adding weight to the reversal signalled by the pattern. For instance, if a deep crab pattern completes at a 1.618 Fibonacci extension and RSI shows oversold conditions in the stock or index, it strengthens the case for a bullish reversal.
Volume analysis also offers clues: a drop in volume during the CD leg and a spike at the reversal point often accompany the deep crab pattern.
Using a combination of Fibonacci ratios, momentum indicators, and volume signals increases your confidence in spotting genuine deep crab patterns. Relying on price action alone can lead to false positives, especially in volatile markets like the Indian stock market.
By mastering the appropriate timeframes and confirming signals with these tools, traders can better harness the deep crab pattern’s potential to spot lucrative trading opportunities.
Using the deep crab pattern effectively can sharpen your trading strategy by identifying potential market reversals with more confidence. The pattern’s distinct Fibonacci ratios give you concrete entry and exit points, helping you make decisions in volatile markets like India’s equity scene. Trading strategies centred around this pattern focus on spotting reversal zones, timing trades, and managing risk carefully.
Timing your entry in trades based on the deep crab pattern requires recognising the completion of the CD leg, which is usually an extended move beyond the XA leg at a 1.618 Fibonacci retracement or even deeper. For example, if you spot a deep crab pattern forming on the Nifty 50 chart, you would look to enter a buy trade near the point D, the extreme low, expecting a rebound.
Entry should be confirmed with additional signals such as candlestick patterns—like a hammer or bullish engulfing formation—or indicators like RSI showing oversold conditions. Exiting a trade typically involves setting profit targets using Fibonacci extensions from the pattern’s legs. A common approach is to aim for the 0.382 or 0.618 retracement of the CD leg for partial profits.
Stop-loss placement is equally crucial; it is generally placed just beyond the pattern's extreme point D to reduce losses if the pattern fails. For instance, if you enter a long position at ₹15,000 in reliance on a deep crab formation, placing a stop-loss at ₹14,850 protects your capital against unexpected market swings.
Even the most reliable patterns can give false signals, so controlling risk effectively is non-negotiable. One practical method is to use position sizing relative to your risk tolerance. Suppose your maximum acceptable loss per trade is ₹5,000; calculating your position size based on this risk ensures you don’t blow up your account with one bad trade.
Besides stop-losses, traders often employ trailing stops to protect profits as the market moves in their favour. In rapidly changing markets like India’s, with events such as RBI policy announcements or global economic shifts, trailing stops help lock in gains even if the pattern breaks down later.
Diversification across multiple instruments also helps smooth out risk, preventing overexposure to a single deep crab pattern failure. Plus, keeping an eye on volumes during pattern formation adds another layer of validation—higher trading volumes at point D strengthen the pattern’s reliability.
Successful trading with the deep crab pattern boils down to disciplined entry and exit decisions, paired with strict risk management techniques that suit the unpredictable nature of Indian markets.
These practical entry, exit, and safety measures allow you to make the most of the deep crab pattern, enhancing your trading approach in equities, commodities, or currencies traded on Indian platforms.
The deep crab pattern, while valuable in predicting market reversals, comes with its share of limitations that traders must handle carefully. Understanding these challenges helps in using the pattern more effectively rather than depending on it blindly. Like any technical tool, it is far from infallible and requires experience and complementary analysis to make profitable trades.
One major challenge with the deep crab pattern is its tendency to generate false signals, especially in volatile markets. Sudden news events, economic data releases, or government policy changes can cause sharp price movements that disrupt the expected pattern shape. For example, during the monsoon months, the Indian market shows increased volatility in commodities like crude oil and agriculture stocks, which often creates noise around harmonic pattern formations.
These false signals can lead to premature entries or exits, wiping out profits or increasing losses. Traders often find that relying solely on the deep crab pattern without confirming with other indicators like Relative Strength Index (RSI) or Moving Average Convergence Divergence (MACD) can backfire in such situations. Combining volume analysis and candlestick patterns alongside the deep crab pattern tends to provide stronger confirmation and reduce the impact of false alarms.
Even experienced traders sometimes face difficulties filtering reliable deep crab patterns during sudden market swings, making risk management crucial.
The Indian market context presents unique factors that affect the application of the deep crab pattern. The market is influenced heavily by domestic developments such as RBI monetary policy decisions, GST changes, or corporate earnings season, which may not always reflect in classic harmonic structures neatly. For example, abrupt policy announcements can cause price gaps that distort the XA, AB, BC, and CD legs critical for pattern identification.
Moreover, liquidity and trading volume can vary significantly between large-cap stocks and mid or small-cap ones. Deep crab patterns found in mid-cap stocks on the NSE may not perform as expected due to thinner volumes and higher spreads. Indian traders should therefore customise their use of the pattern, focusing on liquid stocks and indices like Nifty 50 or Bank Nifty, where price movements are more reliable.
Additionally, Indian trading hours and festival-related trading holidays impact pattern formation timing. Reduced trading volumes around Diwali or end of financial year can stretch or compress price waves, requiring adjustments in timeframes used for identifying the pattern.
Traders in India may find it useful to incorporate local market insights alongside technical analysis. For instance, using domestic economic indicators and sectoral health helps in validating patterns. This approach allows the deep crab pattern to be a part of a more comprehensive strategy rather than a stand-alone signal.
By recognising these limitations and adapting strategies accordingly, traders can exploit the deep crab pattern more realistically within India’s dynamic market environment.
📚 Explore e-book trading in India: buy, sell, and exchange digital books legally on key platforms, learn copyright rules, and enjoy diverse reading affordably.

📊 Learn to use TradingView effectively for binary trading in India 🇮🇳. Discover strategies, risk management, and tools to trade smarter and make informed decisions.

Explore Qutex trading 📈 with this detailed guide—learn core concepts, setup, execution & risk management to trade smartly in India’s market 🇮🇳.

📈 Explore Quotex trading essentials, from platform features to risk management tips, helping Indian traders start smart and trade confidently.
Based on 6 reviews