

Understanding Quptex: A Clear Guide
Explore Quptex: its features, uses, security, and user insights. Learn how this tech fits India's growing digital scene. 🔍💡🇮🇳
Edited By
Charlotte Davies
Chart pattern analysis forms a vital part of understanding market movements. By studying recurring shapes on price charts, traders and investors can anticipate potential trend shifts and pricing behaviour. This method relies on recognising patterns created by the movement of price over time, helping one to make more informed decisions instead of guessing blindly.
Patterns like head and shoulders, double tops and bottoms, and flags often signal trend reversals or continuations. For example, a head and shoulders pattern generally indicates a bearish reversal after an uptrend, meaning prices might soon decline. On the other hand, a flag pattern usually represents a brief consolidation before a trend continues, which traders can use to time their entries.
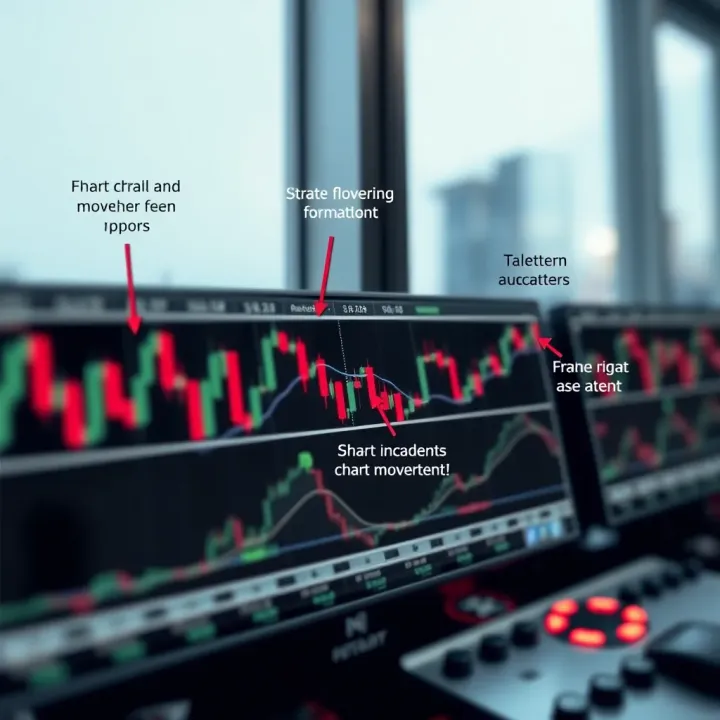
Using chart pattern analysis effectively requires regular study and practice. Traders often refer to PDF resources that summarise major patterns, their implications, and real market examples. These PDFs serve as handy guides when analysing stock price charts on platforms like NSE or BSE, especially for freshers or less-experienced investors.
Understanding chart patterns is more than spotting shapes; it’s about interpreting market psychology—how buyers and sellers react at key price levels.
Here are key reasons why PDF guides on chart patterns prove useful:
Easy Reference: Accessible anytime for quick pattern identification when trading.
Consistent Terminology: Clear definitions help avoid confusion across different market conditions.
Step-by-step Examples: Visuals alongside explanations support better retention and application.
For those dealing specifically in Indian markets, using chart pattern PDFs that incorporate examples from Sensex and Nifty stocks adds real-world context. This relevance helps in grasping nuances better than generic global templates.
Ultimately, the goal is to equip readers with tangible skills to read charts more confidently. This empowers investors and traders alike to seize opportunities efficiently and manage risks effectively. Refer to updated PDFs regularly to stay sharp and adapt to evolving market behaviour.
Chart pattern analysis helps traders and investors read price charts to understand market trends and potential reversals. Instead of guessing, this analysis lets you observe how prices have moved historically, which can guide decisions on when to buy or sell. For example, spotting a 'double top' pattern early may alert you that a stock's uptrend is weakening, signalling a chance to book profits or reduce exposure.
Price charts are visual tools that plot the movement of an asset’s price over time. The most common types are line, bar, and candlestick charts, with candlesticks especially popular in India’s stock and commodity markets due to the clear information they offer on opening, closing, high, and low prices. Traders use these charts as a first look at price action to understand momentum and volatility. For instance, a candlestick with a long wick on the top may indicate selling pressure even if the price closed higher, which could affect short-term trading decisions.
Patterns form because traders act in predictable ways around price levels, such as support, resistance, and psychological price points. These repeated behaviours create shapes on charts like head and shoulders or triangles. Such patterns reflect collective market sentiment—whether bulls or bears dominate and whether momentum is likely to continue or reverse. Take the 'flag' pattern often seen in share prices like Reliance Industries during consolidation phases; it suggests a pause before the trend picks up again. Understanding these patterns helps traders interpret the underlying supply-demand dynamics rather than rely on random hunches.
Chart pattern analysis is not about finding exact predictions but rather recognising tendencies and probabilities that guide smarter trading choices.
Using chart pattern analysis provides practical benefits such as timing entries and exits better, managing risk through stop-loss placement, and improving overall trade planning. India's growing retail trading landscape, especially with platforms like Zerodha and Upstox, has made understanding these patterns more accessible. This helps traders avoid common traps like buying at tops or selling at bottoms, which can erode gains over time.
In short, learning how to read price charts and recognising patterns unlock insights into market behaviour, offering traders a systematic edge in evaluating price movements.
Chart patterns are the backbone of technical analysis, helping traders spot potential market moves before they unfold. Understanding common patterns equips you with clues about when trends might reverse or continue, allowing more precise timing for buying or selling.
The Head and Shoulders pattern signals a shift from bullish to bearish trends and is one of the most reliable reversal indicators. It consists of three peaks: the highest peak (head) flanked by two lower peaks (shoulders). When the price breaks below the neckline connecting the shoulders, it suggests selling pressure will increase. For example, if Reliance Industries’ stock forms this pattern on its daily chart and breaks the neckline at ₹2,300, traders might expect a downward move and plan exit or short trades accordingly.

A Double Top forms when the price hits a resistance level twice and fails to break through, signalling a potential bearish reversal. Conversely, a Double Bottom occurs when the price tests a support level twice, likely marking a bullish reversal. Think of ICICI Bank's stock hitting ₹700 twice but dropping thereafter, indicating a Double Top. Traders watch for confirmation by price closing below the intermediate low after the second peak for exit signals.
These are rarer but stronger versions of double tops and bottoms. A Triple Top means the price tests resistance three times without succeeding, reinforcing bearish pressure. A Triple Bottom signals stronger support, with price bouncing thrice at a level, hinting at more robust buying interest. For instance, if Infosys stock hits ₹1,400 thrice before falling, this pattern may mean an impending downtrend. The key is waiting for the price to break the support or resistance line before acting.
Flags and Pennants are short pause patterns that suggest the prevailing trend will continue. Flags look like small rectangles slanting against the trend, while Pennants resemble small triangles formed by converging trend lines. In the middle of a strong uptrend, HDFC Bank stock may show a flag pattern. Traders often enter positions after price breaks out of this consolidation, expecting the prior trend to resume.
Triangles appear when price movement narrows by forming converging trend lines. There are three types: ascending, descending, and symmetrical. Ascending triangles often point to bullish continuation, with resistance flat and support rising, seen for example in stocks like Tata Motors before a rally. Descending triangles suggest bearish continuation. Symmetrical triangles can break either way but show market indecision.
Rectangles form when price moves sideways between parallel support and resistance lines, indicating a pause before continuation or reversal. For example, if L&T stock fluctuates between ₹1,500 and ₹1,550 for days, it forms a rectangle. Breakouts above or below these levels signal strong moves—traders keep an eye on volume to confirm genuine breakouts.
Mastery over these patterns helps traders identify entry and exit points confidently rather than relying on guesswork. Chart patterns provide a practical map of market psychology, reflecting collective behaviour that drives price action.
Common chart patterns are essential tools, and recognising them well can improve your trading outcomes significantly.
Chart pattern analysis PDFs offer practical tools for traders and investors who want to keep key market insights at their fingertips. By having these guides saved on your mobile or laptop, you can refer to them anytime during trading sessions, saving valuable time and improving decision-making accuracy. These PDFs are especially useful during volatile markets, when spotting reliable patterns quickly can make a big difference.
A PDF guide provides an organised, portable summary of important chart patterns, explaining how to identify and interpret them without sifting through lengthy articles or videos. For example, if you observe a triangle pattern forming on a stock like Reliance Industries, you can open the PDF immediately to refresh your understanding of whether it signals continuation or reversal. This instant access helps avoid missed opportunities or unnecessary hesitation.
Moreover, PDF guides usually include clear diagrams alongside concise explanations. This visual clarity supports faster pattern recognition when scanning live charts. Unlike web pages, PDFs do not depend on internet connectivity, so they’re accessible even when you have poor network coverage, such as travelling in rural areas or during power cuts.
When choosing a chart pattern analysis PDF, consider these qualities to get the most value:
Clarity and simplicity: Look for straightforward language supported by labelled diagrams. A good PDF avoids jargon and explains patterns with practical examples, like illustrating a head and shoulders pattern during bearish phases in Nifty 50.
Comprehensiveness: The guide should cover common reversal and continuation patterns, preferably with real-world case studies or screenshots reflecting Indian market scenarios.
Up-to-date content: Markets evolve, so the PDF should reflect recent trading tools, incorporate insights from SEBI guidelines, and mention utilisable indicators like RSI or volume confirmation to strengthen pattern reliability.
Searchability: Ability to search keywords within the PDF speeds up referencing during fast trading exercises.
Portability and format: Files that open smoothly on mobile apps, like Adobe Reader or Google PDF Viewer, without layout distortion are preferred.
Using a well-designed chart pattern PDF is a practical way to reinforce your technical analysis skills while saving time. It shifts your focus from guesswork to informed calls based on standard patterns recognised worldwide and tested in Indian contexts.
In sum, keep a chart pattern PDF ready on your device during trading hours. Regularly revisiting it hones pattern familiarity. Over time, this habit will sharpen your trading instincts and help you spot opportunities confidently in the fluctuating market.
Chart patterns offer valuable insights, but their real worth shines when applied alongside other tools to make informed trading decisions. Simply spotting a pattern without context can be misleading. Practical application means understanding how patterns fit within the broader market environment and combining them with other technical indicators.
Relying solely on chart patterns can lead to false signals. That's why combining them with indicators like the Relative Strength Index (RSI), Moving Averages (MA), or the Moving Average Convergence Divergence (MACD) improves accuracy. For instance, consider a Head and Shoulders pattern signalling a potential trend reversal. If the RSI also shows overbought conditions, this strengthens the reversal signal. On the other hand, if the RSI remains neutral, it might be wise to wait for further confirmation.
Moving averages help identify trend direction and support or resistance levels. When a triangle pattern forms near a 50-day MA, a breakout above this line could confirm a strong trend continuation. Similarly, volume analysis adds weight; a breakout accompanied by rising volume generally confirms genuine market conviction.
Combining chart patterns with other indicators reduces risks and provides a clearer picture of potential price movements.
Imagine you spot a Double Bottom pattern on the daily chart of a stock like Reliance Industries. The pattern suggests a possible bullish reversal. A trader might wait for the price to break above the neckline with a volume surge as confirmation. Once confirmed, buying near the breakout level with a stop loss just below the recent low minimises risk.
Similarly, in an intraday scenario, a Bullish Flag on an Nifty futures chart might indicate continuation after a strong uptrend. A trader could enter once the price breaks above the flag’s upper boundary and exit if it falls back within the pattern.
Traders should also watch out for false breakouts. Suppose a Triangle pattern points to an impending breakout but lacks volume support; in such cases, it might be safer to wait for a retest of breakout levels before entering.
Applying chart patterns this way helps you make decisions rooted in evidence rather than guesswork. It works well to use downloadable PDF guides that recap these techniques, allowing quick reference during live trades.
In short, understanding how to marry chart patterns with other technical tools greatly improves your chances of success in the market. It lets you anticipate price moves with more confidence and fine-tune your entries and exits accordingly.
Accessing trustworthy chart pattern analysis PDFs is essential for traders and investors who want to make sound decisions based on accurate information. These resources save time and offer structured insights to understand market trends better. However, not all PDFs available online maintain the quality and reliability needed for effective trading.
When hunting for dependable chart pattern analysis PDFs, it's best to stick with recognised financial education sites and official market platforms. Websites like the National Stock Exchange of India (NSE) and Bombay Stock Exchange (BSE) occasionally provide educational material that includes pattern analysis. Likewise, trading academies such as Elearnmarkets and Zerodha Varsity publish comprehensive guides crafted by market professionals.
Internationally respected platforms like Investopedia and TradingView also offer detailed resources that many Indian traders find useful. These PDFs typically explain common chart patterns with real examples, enabling you to relate them to Indian market conditions. Additionally, some brokerage firms provide downloadable PDFs to their clients for quick reference, tailored to domestic markets and regulations.
It’s wise to confirm the source before downloading or trusting any chart pattern PDF. Start by checking who created the material—reliable content usually comes from recognised institutions or established market educators. Look for clear author credentials or endorsements by financial experts.
Pay attention to the date of publication. Market dynamics shift frequently, so outdated materials may not reflect current trading realities or new financial regulations. Also, cross-check facts or strategies against more than one source, ensuring consistency.
Beware of PDFs that promise guaranteed profits or overly simplistic solutions. Trading rarely offers surefire success, and credible guides will always mention risks alongside opportunities. Lastly, consider feedback or reviews from fellow traders who have used those resources to see if the material is genuinely beneficial.
Strong, reliable chart pattern PDFs can sharpen your trading skills but verifying their authenticity itself is just as crucial for your market success.
By focusing on trusted platforms and applying these checks, you ensure access to high-quality PDFs that support your trading goals effectively and responsibly.
Explore Quptex: its features, uses, security, and user insights. Learn how this tech fits India's growing digital scene. 🔍💡🇮🇳

📚 Explore e-book trading in India: buy, sell, and exchange digital books legally on key platforms, learn copyright rules, and enjoy diverse reading affordably.

📊 Learn to use TradingView effectively for binary trading in India 🇮🇳. Discover strategies, risk management, and tools to trade smarter and make informed decisions.

Explore Qutex trading 📈 with this detailed guide—learn core concepts, setup, execution & risk management to trade smartly in India’s market 🇮🇳.
Based on 14 reviews